
What we think

If competitive gaming is your priority and you're looking for a larger screen, the LG 32GQ850 with its higher refresh rate and quicker response will serve you well, especially if you're trying to save a bit of money. However, if you have a higher budget and you're more focused on exceptional image quality for productivity, watching videos, or photo editing, the Sony M9 offers superior image clarity, higher resolution, and better color performance, along with being well-suited to HDR gaming and media. Its smaller screen is sharper due to a higher pixel density. Keep in mind, for the best competitive gaming performance, the LG's advantages are valuable, while the Sony excels in media and productivity uses. Give Feedback
- Very good refresh rate
- Good for casual gaming
- Best in class for productivity
- Good for media consumption
- Very good text clarity
- Very good image clarity
- Good contrast
- Good brightness
- Good color volume
Key differences
Casual Gaming
Productivity
Media Consumption
Cost
$200
$400
$600
$800
$1,000
$1,200
HDR Gaming and Media Consumption
Print Photo Editing
Key similarities
Competitive Gaming
Digital Photo Editing
HDR Video Editing and Color Grading
Give feedback
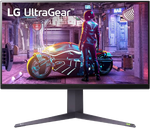
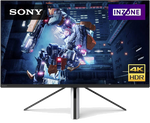
How the LG 32GQ850 (IPS) and the Sony M9 (IPS FALD) compare to other monitors
Spec Comparison
| LG 32GQ850 (IPS) | Sony M9 (IPS FALD) |
GENERAL | |||
|---|---|---|---|
| Price | |||
$718 | $800 | ||
Screen Size | |||
Screen Size | 32" | 27" | |
Resolution | |||
Resolution | 2560 x 1440 | 3840 x 2160 | |
Screen Type | |||
Screen Type | LED | LED | |
Screen Sub-type | |||
Screen Sub-type | IPS | IPS FALD | |
Local Dimming Zones | |||
Local Dimming Zones | 16 | 96 | |
COLOR, CONTRAST & BRIGHTNESS | |||
|---|---|---|---|
Native Contrast | |||
Native Contrast | 1000:1 | 1000:1 | |
SDR Peak Brightness | |||
SDR Peak Brightness | 150 nits | 432 nits | |
HDR Peak Brightness | |||
HDR Peak Brightness | 600 nits | 695 nits | |
Suitable for HDR Gaming and Media Consumption | |||
Suitable for HDR Gaming and Media Consumption | No | Yes | |
sRGB Color Gamut | |||
sRGB Color Gamut | 135 % | 100 % | |
MOTION CHARACTERISTICS | |||
|---|---|---|---|
Total Response Time | |||
Total Response Time | 8 ms | 8 ms | |
Variable Refresh Rate | |||
Variable Refresh Rate | 48 - 260 Hz | 24 - 144 Hz | |
Strobing / BFI | |||
Strobing / BFI | No | No | |
Persistence Blur Score | |||
Persistence Blur Score | 8.3/10 | 6.6/10 | |
Ghosting Score | |||
Ghosting Score | 7.6/10 | 7.6/10 | |
TEXT & IMAGE CLARITY | |||
|---|---|---|---|
Pixels Per Inch | |||
Pixels Per Inch | 93 PPI | 163 PPI | |
Coating | |||
Coating | Matte | Matte | |
Text Clarity Score | |||
Text Clarity Score | 6.3/10 | 8/10 | |
Image Clarity Score | |||
Image Clarity Score | 6.3/10 | 8/10 | |
PORTS & CONNECTIVITY | |||
|---|---|---|---|
HDMI 1.4 Ports | |||
HDMI 1.4 Ports | 0 | 1 | |
HDMI 2.0 Ports | |||
HDMI 2.0 Ports | 0 | 0 | |
HDMI 2.1 Ports | |||
HDMI 2.1 Ports | 1 | 2 | |
Micro HDMI Ports | |||
Micro HDMI Ports | 0 | 0 | |
DisplayPort 1.2 Ports | |||
DisplayPort 1.2 Ports | 0 | 0 | |
Give feedback
More comparisons for you
FAQs
Why trust us
By the numbers
About the monitor team
Joe Golden, Ph.D
Jason Lew
Chandradeep Chowdhury
Featured in