iPhone 15 could be the most affordable iPhone since '07 adjusted for inflation

This week, lots of Apple publications shared leaked pricing for the upcoming iPhone 15 model line. If the rumors are true, the prices for the iPhone 15 and 15 Plus will remain the same as the iPhone 14 line, at $799 and $899 respectively. The iPhone 15 Pro and Pro Max will see their starting prices increase by $100 each, to $1099 and $1199 respectively.
While the price increases for the iPhone Pro have gotten a lot of attention, the perhaps more remarkable story is the lack of price increases for the base iPhone during a period of high inflation. If the rumors are true, the iPhone 15 will have the same starting price as the iPhone 12, released in 2020, despite the fact the US has experienced 18% inflation since then according to the Bureau of Labor Statistics's inflation calculator. It is typical for Apple to go three or four years without increasing its retail prices, but in the past that has occurred in a low inflation environment.
How the iPhone 15's price compares to other iPhones
We decided to take a look at the inflation-adjusted price of every iPhone. What we found is that if the rumors are true:
The iPhone 15 will be the most affordable base model since the original iPhone was released in 2007
The iPhone 15 Plus will be the most affordable large iPhone ever.
Despite the fact the iPhone 15 Pro and Pro Max will see their prices increase this year, the overall trend for Apple’s premium phones is that they are getting cheaper in inflation-adjusted terms.
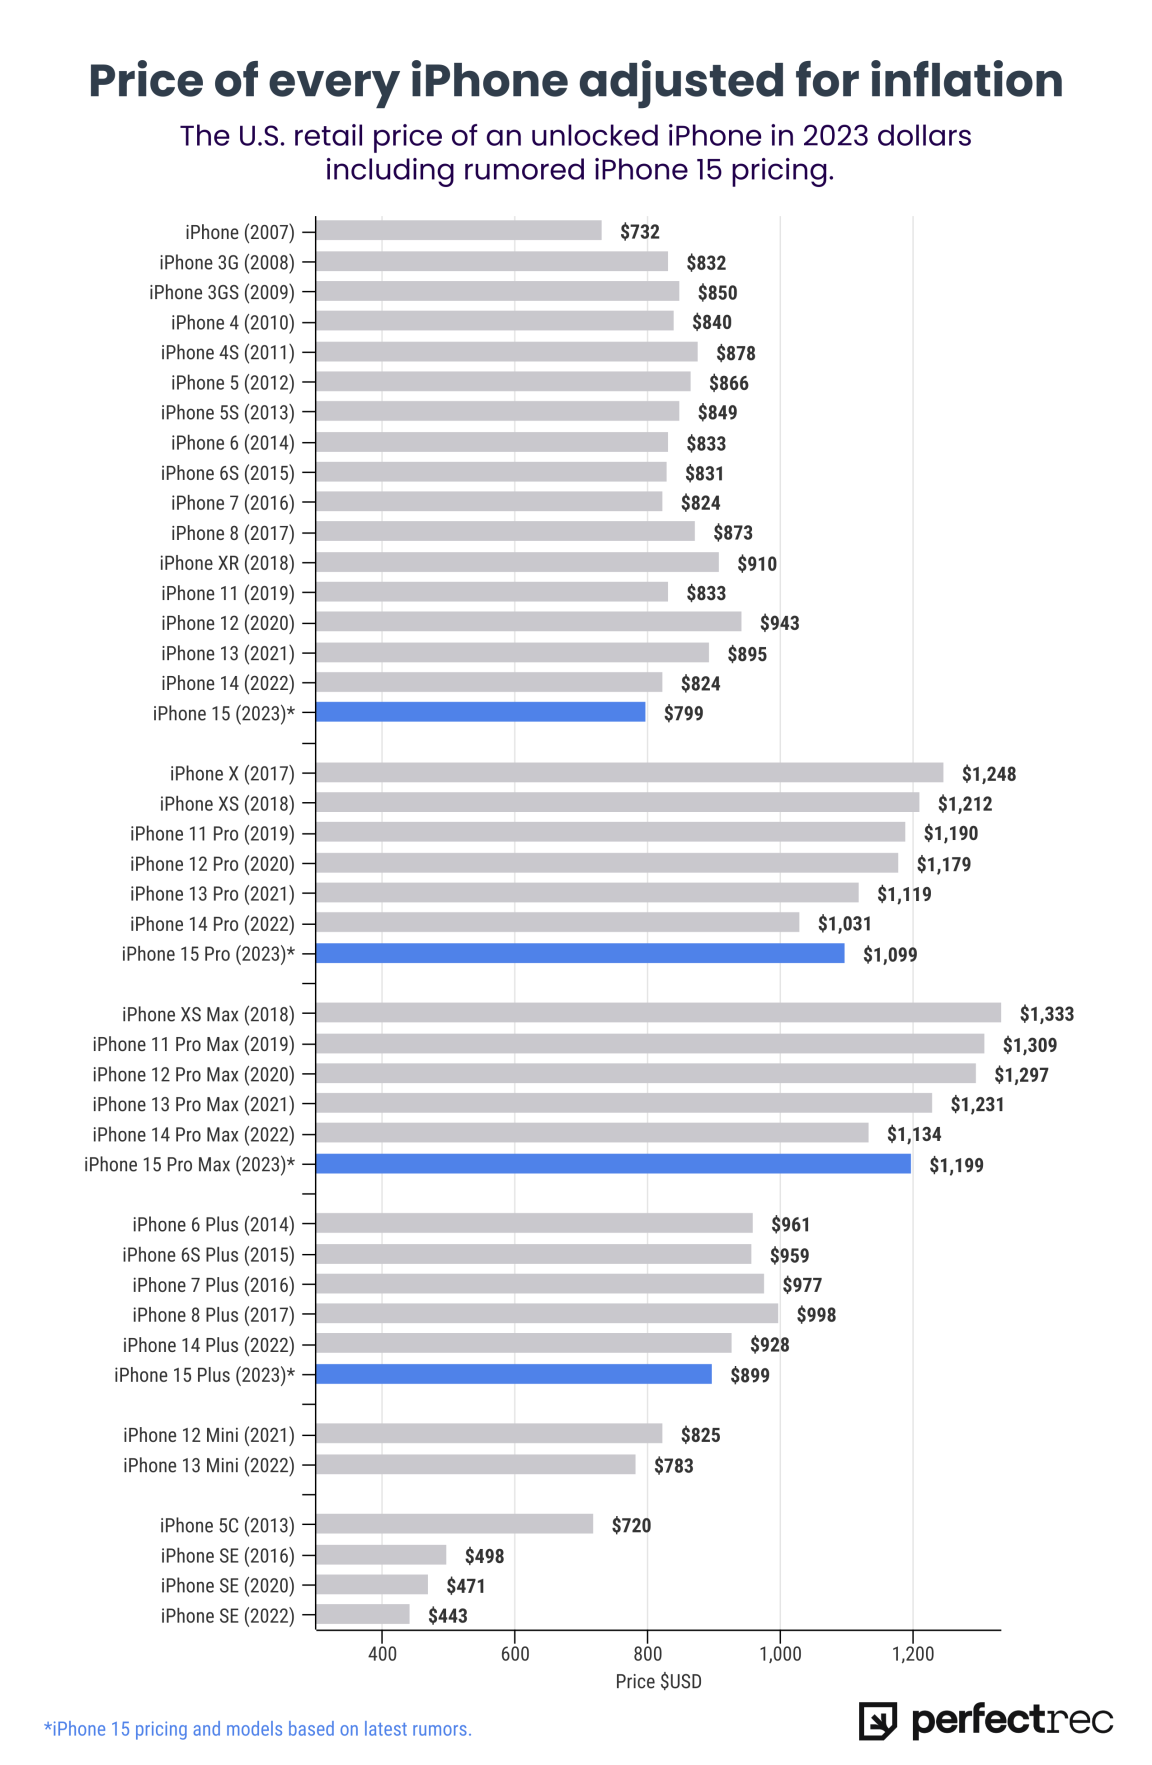
Every iPhone's retail price, adjusted for inflation
Here’s the full chart of every iPhone's retail price in 2023 dollars. We’ve grouped similar models (Pro, Pro Max, Mini, ect.) together for easier comparison. The initial retail price is for an unlocked, unsubsidized phone with the lowest memory configuration.
Here is an alternate view that makes it easier to see the price decrease for the iPhone Pro and Pro Max lines.
Here is the iPhone price history in nominal terms without any inflation adjustment.
Data
Here are all of Apple's iPhone skus released since 2007, including their nominal starting price and their inflation-adjusted price in 2023 dollars.
Model | Year released | Initial U.S. retail price | Inflation adjusted price |
iPhone | 2007 | $499 | $732 |
iPhone 3G | 2008 | $599 | $832 |
iPhone 3GS | 2009 | $599 | $850 |
iPhone 4 | 2010 | $599 | $840 |
iPhone 4s | 2011 | $649 | $878 |
iPhone 5 | 2012 | $649 | $866 |
iPhone 5S | 2013 | $649 | $849 |
iPhone 6 | 2014 | $649 | $833 |
iPhone 6S | 2015 | $649 | $831 |
iPhone 7 | 2016 | $649 | $824 |
iPhone 8 | 2017 | $699 | $873 |
iPhone XR | 2018 | $750 | $910 |
iPhone 11 | 2019 | $699 | $833 |
iPhone 12 | 2020 | $799 | $943 |
iPhone 13 | 2021 | $799 | $895 |
iPhone 14 | 2022 | $799 | $824 |
iPhone 15 | 2023 | $799 | $799 |
iPhone X | 2017 | $999 | $1,248 |
iPhone XS | 2018 | $999 | $1,212 |
iPhone 11 Pro | 2019 | $999 | $1,190 |
iPhone 12 Pro | 2020 | $999 | $1,179 |
iPhone 13 Pro | 2021 | $999 | $1,119 |
iPhone 14 Pro | 2022 | $999 | $1,031 |
iPhone 15 Pro | 2023 | $1,099 | $1,099 |
iPhone XS Max | 2018 | $1,099 | $1,333 |
iPhone 11 Pro Max | 2019 | $1,099 | $1,309 |
iPhone 12 Pro Max | 2020 | $1,099 | $1,297 |
iPhone 13 Pro Max | 2021 | $1,099 | $1,231 |
iPhone 14 Pro Max | 2022 | $1,099 | $1,134 |
iPhone 15 Pro Max | 2023 | $1,199 | $1,199 |
iPhone 6 Plus | 2014 | $749 | $961 |
iPhone 6S Plus | 2015 | $749 | $959 |
iPhone 7 Plus | 2016 | $769 | $977 |
iPhone 8 Plus | 2017 | $799 | $998 |
iPhone 14 Plus | 2022 | $899 | $928 |
iPhone 12 Mini | 2020 | $699 | $825 |
iPhone 13 Mini | 2021 | $699 | $783 |
iPhone 5C | 2013 | $549 | $720 |
iPhone SE | 2016 | $399 | $498 |
iPhone SE | 2020 | $399 | $471 |
iPhone SE | 2022 | $429 | $443 |
Methodology
We looked at the U.S. retail price for unlocked phones purchased without a contract or carrier subsidy. We looked at the lowest cost version of each phone, without any memory upgrades.
Inflation adjustments are made using the Bureau of Labor Statistics inflation calculator comparing July of the launch year to July 2023, the last month for which data is available.
Comparison bar chart was made using Venngage. The line charts were made with RStudio.
Other recommended articles

CHART: Elon Musk net worth and Twitter habit

Chart: Streaming Service Churn Rates

Who is thinking about the Roman Empire?

CHART: The price history of the Samsung Galaxy S, adjusted for inflation
Stay up to date on new products
Get occasional updates about new product releases, interesting product news, and exciting PerfectRec features. No spam. We never share your email.